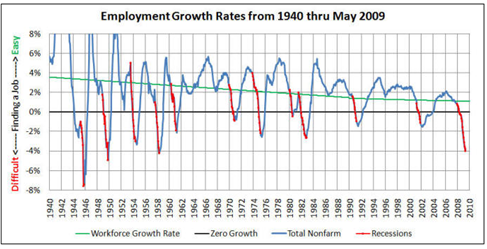
We talked about a particular graph he developed showing the trends of the recession… I had seen this graph before but listening to him talk about various points, like times in history, what the trends mean, his predictions, etc. was fascinating. It was one of those times I wished I had my JibberJobber family/users on the call.
Fortunately, Mark agreed to talk about it on a webinar – there is limited seats available so hurry and register here. We will do this webinar on Tuesday, July 21at 11am MST (that is 10am PST, noon CST, 1pm EST, and I have no idea what time it is in Arizona – you’ll have to do your own math on that).
If you have any questions for Mark, please leave them in the comments on this blog post. Otherwise, GoToWebinar will allow you to ask questions during the webinar, but I guarantee we won’t get through all of the questions.
Here’s the graph we’ll talk about (we might go to other graphs):
Finally, I didn’t know what to call this webinar… some of these came to mind:
- Where is the recession headed?
- When will the recession end?
- What should I do in my job search, career, or business, at this stage of the recession?
I guess it could all be summed up with “where are we at, where are we headed, and what does this mean for me?”
If you want to learn more about Mark you can check him out here:
- Mark Hovind (JobBait.com) on Brands, Tag Lines, and “Getting It” (JibberJobber blog post)
- Networking Doesn’t Work (JibberJobber blog post)
- Are you a “Fierce” Job Hunter? (Total Picture Radio interview)
Sign up for this webinar here, and tell all of your friends about it!


Thanks for your notes on the recession and your graph on employment growth rates. I was curious about something. So I went on line to see if there was any correlation between major historical events (wars in particular) and positive growth in employment. I found that there was one definite similarity and this may be old news to you guys. The beginning of each major war from 1939 through 1991 was also the beginning of a major positive employment growth spike, each of which lasted from 1 to 3 years. The Vietnam War had many spikes throughout its duration and the first Gulf War’s spike lasted 4 years after that war was over. Are there any other good barometers that can be used to measure when positive employment growth can be expexted? and does positive employment growth necessarily mean that the economy and the dollar are getting stronger?
Thanks again,
Bob Towle
Wow, interesting data points. As I mentioned to Jason on Twitter, I’m not sure if I should be scared or encouraged!
The one line that really jumps out at me is the green one…if I’m reading this correctly, does that mean that the overall rate of growth of employment here in the U.S. is moving in a downward direction?
Does this correlate with the growth of technology, decrease in need for skilled/unskilled labor, and off-shoring of jobs? If so, then in absolute numbers….there aren’t going to be as many jobs out there when the “recovery” happens…?
Is it a reflection of a decreasing birthrate?
Inquiring minds want to know 🙂
Looking forward to the seminar ~